
Why Most Fuel Savers Do Not Work — And How to Check the Ones That Claim To
Why Most Fuel Savers Do Not Work And How to Check the Ones That Claim To
Don’t go by the advert. Go by the documents. This page shows you how to tell the difference, then lays out Greentech’s customer sites, signed documents and the maths behind a fuel-saving figure.
You have probably been told that fuel-saving devices are a scam. That is a fair impression. Most of this category really is fake. This page covers three things: why the category turned out this way, how to tell a real product from a story, and what Greentech’s own documents look like.
First, the honest part: most fuel savers do not work
The US Environmental Protection Agency runs a programme that tests aftermarket fuel-saving devices and publishes the results. The US Federal Trade Commission summed those results up in one sentence:
“The EPA has found very few that provide any benefits, and some products can damage your engine or greatly increase exhaust emissions.”
One more thing worth knowing: the EPA does not approve, certify or endorse any fuel-saving product. So if a seller says they are “EPA approved”, that statement is false. Nobody can be, including us.
A real case: Firepower
In 2004 a company called Firepower started in Perth, Australia. It sold a pill you dropped into the fuel tank, said to cut fuel use and clean the engine.
Western Australia’s consumer protection department tested it. The result: no effect.
In July 2008 the Australian business went into liquidation. Retail investors are estimated to have lost around A$100 million. In July 2011 the Australian securities regulator banned the founder from managing companies for twenty years.
This is a company that sells fuel-saving devices telling you all of that. We would rather you knew what the category looks like before you read our documents, instead of finding out afterwards and deciding we hid it.
A pill and a device are not the same thing
Firepower sold a pill: dropped in the tank, burned up, bought again at the next fill.
Greentech sells a device: it sits in the tank for ten years and is never consumed.
That difference is more basic than whether either one works:
| A fuel pill | Greentech | |
|---|---|---|
| What it is | A chemical dropped in the tank and used up. | A sealed device. Fitted once, lasts ten years. |
| Why it should work | Usually not published. | Structure and materials are set out in patents in multiple countries. Anyone can pull the file. |
| Who tested it | Nobody, or nobody you can name. | Ethiopia’s national laboratory, with the model number in the report. Veritas in India, on ten state buses. |
| Who uses it | Individuals reached by advertising. | Factory boilers, production lines, and commercial fleets in four countries. |
| Who sells it | Straight to the public. | Appointed distributors in Vietnam, India, the UAE and Ethiopia. In India, Ashok Leyland’s dealer group. |
| The business model | You buy it again at every fill. | You buy it once. There is no second sale. |
| Can you test it first | “Just try it and see.” | Your own before-and-after fuel records, logged online or on a worksheet we supply. |
The last two rows matter most. A pill’s business is that you keep buying. Ours is that you buy once. Something you only sell once cannot survive on a placebo, because the customer never comes back and there is no second payment to collect.
Real cases, and every one has a name
Fuel-saving pills are sold with illustrations and anonymous testimonials. Every card below names a company or an official body and a country, and links to a document you can open. Each result is different. That is what real measurement looks like, and how the saving is calculated explains why.


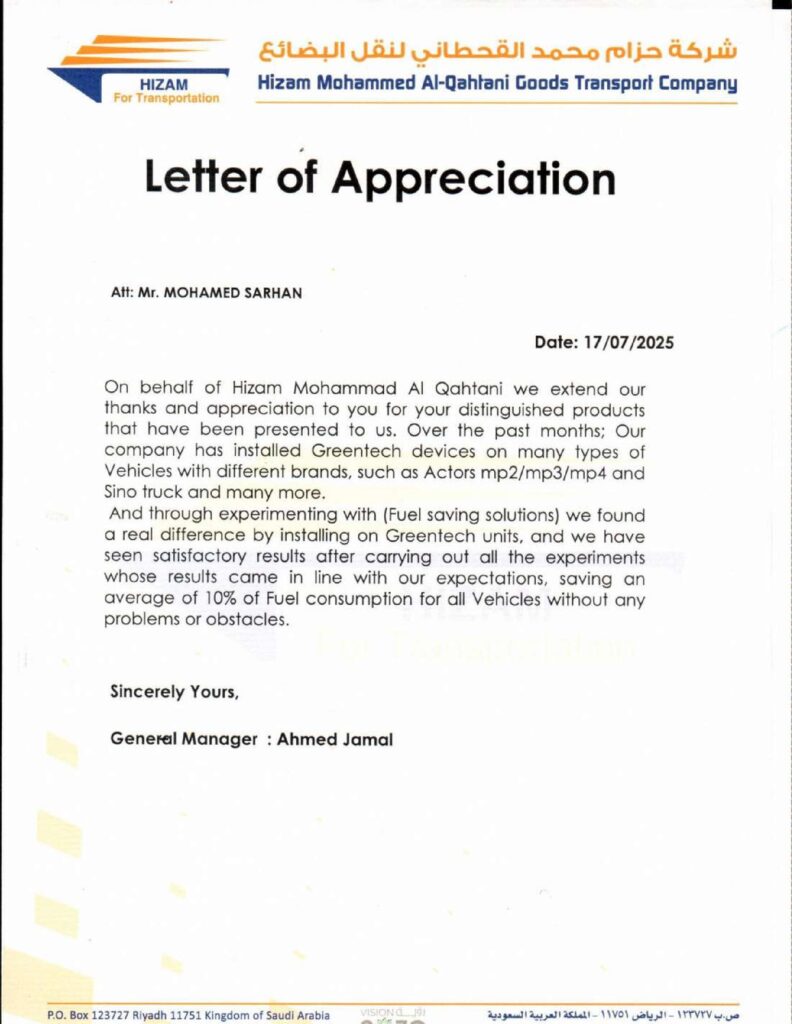


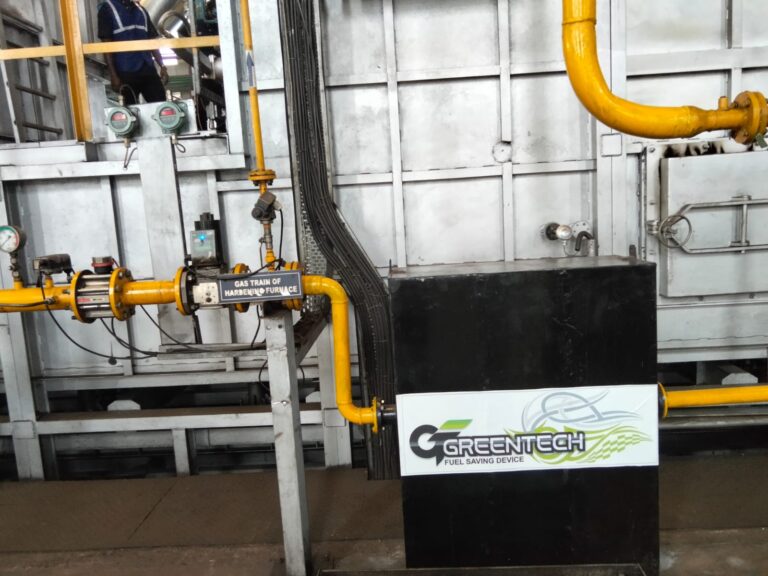
Results vary with engine condition, load, route and driving. Each figure is the one in that company’s or authority’s own document.
Why the category turned out like this
1. One number for every vehicle cannot be true
If a product says it saves 20 per cent, it is saying it does the same thing on every engine, on every road.
Engine makers cannot do that. The same engine in city traffic and on an open highway already differs by more than that.
Modern engines are tuned tightly, so there is not much room left, and the amount of room depends on the vehicle. Older engines, heavy loads and long steady runs have the most to gain. Newer engines, light loads and stop-start traffic have the least. At idle there is almost nothing.
So a believable claim looks like this: 7 per cent on one truck, 13 on another.
A headline number is not the problem by itself. A best case is worth quoting when it is labelled as a best case, on a named vehicle, in a report you can open. What should make you pause is one figure presented as what everyone gets, with nothing behind it.
2. Fuel economy is hard to measure
The same truck on the same route can differ by ten per cent or more from one week to the next. Load, traffic, weather, tyre pressure, fuel batch and who is driving all move the number.
So a single tank-to-tank comparison proves nothing, good or bad.
And that is exactly the test a seller likes to suggest. Run it enough times and one of them will look good.
3. People who have paid want it to have worked
A driver who has just spent money tends to drive a little more gently for a few weeks. That alone can produce the result.
Nobody is lying. It is human. That is why a serious test does two things: it uses the fleet’s own historical records as the baseline, and it does not tell the drivers which vehicles were fitted.
How the saving is calculated, and why not every vehicle saves 30%
A question we hear a lot: “I heard someone saved 30%. My vehicle measured 8%. Was I cheated?” Usually the difference is not the product. It is a division.
More km per litre = (km per litre after − km per litre before) ÷ km per litre before
Less fuel = (fuel used before − fuel used after) ÷ fuel used beforeover the same distance; for generators and machinery, the same running hours
The same extra 0.9 km per litre, very different percentages
| Vehicle | km per litre before → after |
More km per litre | Less fuel |
|---|---|---|---|
| Bin Sraiya concrete truck, Qatar (measured) | 2.6 → 3.5 | 34.6% | 25.7% |
| Typical truck (arithmetic example) | 9 → 9.9 | 10.0% | 9.1% |
| Well-maintained car (arithmetic example) | 12 → 12.9 | 7.5% | 7.0% |
Each vehicle goes 0.9 km further on every litre. For a truck that only managed 2.6 km, that 0.9 km is more than a third. For a car that already does 12 km, it is less than a tenth. The starting figure is the denominator: a vehicle that is already economical has a big denominator, so its percentage comes out small. Worked out as less fuel, the numbers are a little lower, but they fall in exactly the same order.
Why an economical engine also has less to gain
Greentech helps the fuel atomize finer and burn more completely, so the saving comes from fuel that was not burning completely before. An older engine, carbon build-up, years of heavy loads: plenty of it, and plenty of room to improve. A new, well-maintained engine already burns cleanly and has little room. That is why the big percentages come from thirsty vehicles, and why a single-digit figure on an economical car is still real fuel saved.
When you see a fuel-saving figure, ask which sum was used
The same Bin Sraiya truck can be written up as 34.6% or as 25.7%, and both are correct. Before you compare two fuel-saving figures, check they were worked out the same way. The online Fleet Fuel Log reports the second: less fuel over the same distance.
So do not hold your vehicles to someone else’s percentage. Work it out from your own fuel, and look at the litres as well as the percentage: a fleet that burns 3,000 litres of diesel a month and saves 8% buys 240 litres less every month. Log it in the free online Fleet Fuel Log or the Excel worksheet and the before-and-after sums are done for you, or go straight to a fleet quote.
Results vary with engine condition, load, route and driving.
Five things to ask before you buy
These work on anyone in this category, including us:
- Which model was tested?
- Who did the test, and can I contact them?
- What was measured, and for how long?
- Who has been using it, and for how long?
- Can I measure it on my own vehicles first?
Here are our answers, one at a time.
Greentech’s answers
One thing before the documents: Greentech is a patented, manufactured product.
The core technology holds patents and design rights in multiple countries and regions, including the United States, Taiwan, Vietnam, China, South Africa and the European Union. The US patent number is US 11,713,737 B1, granted August 2023. The units are made in Taiwan.
Why does a patent matter? Because a patent is a public file. An examiner in each of those offices read the claims line by line, and anyone can go and look it up. That is not the same kind of thing as a product that exists only in its own advertising. The certificates are on our patents page.
1. Which model was tested
This is the most important question. If the report does not name a model, you cannot confirm that the thing tested is the thing on sale.
Four of our documents put the model code in the report itself:
| Model | Where it is written | Original |
|---|---|---|
| G10A, D10 | Ethiopian ECAE test report, sample codes ID/0110 B/14 and ID/0110 D/14 | |
| G11, D11, D51 | The “Product Code” column of Belhasa’s test table, Dubai, 2020 | |
| D51 | Bin Sraiya’s report, Qatar, 2023; the four-truck Indian case study, 2025–26 | PDF · PDF |
| D10 | Two 45 KVA generator sets at Goodwill Autos, India, 2022 |
2. Who did the test
The laboratory is ECAE in Ethiopia. It is Ethiopia’s national testing body — the equivalent of a national standards bureau.
Its reports carry a document number, the standard used (CES 6655:2021), the registration and chassis numbers of the vehicles tested, and the signatures of the inspection director and the test team leader.
The rest are tests companies ran themselves. Each report is on that company’s own letterhead, with a reference number, a date and a signature:
| Doha, Qatar | Bin Sraiya Readymix Concrete |
|---|---|
| Dubai, UAE | Belhasa Engineering & Contracting |
| Riyadh, Saudi Arabia | Hizam Mohammed Al-Qahtani Goods Transport |
| Hubli, India | Goodwill Autos |
| Dubai, UAE | SAVEX, reporting to IFFCO’s transport head |
These are real companies. You can look them up.
3. What was measured, and for how long
These vary a lot. The variation is worth more than the headline number, so the weak ones are listed with the strong ones.
| The longest | Four heavy vehicles at two Indian fleets. 219,793 km in total, up to 13 months each. Baselined on the fleets’ own fuel and odometer registers, with no change of route, load or driver. All four improved, between 6.8 and 7.7 per cent. PDF |
|---|---|
| The right metric | Two generator sets, measured in litres per running hour, four months before and four months after. A generator does not travel, so kilometres mean nothing. This is the correct measure for the machine. PDF |
| The laboratory one | ECAE, to standard CES 6655:2021. The fuel run was 99.3 km at 100 km/h plus 7.9 km below that. The report even notes a 20-minute hold-up at a toll plaza. Short, but the method is written down and the vehicles are identified. PDF |
| The weakest | Single-vehicle customer reports over a few weeks. Bin Sraiya is one Mercedes tipper. It is real and signed, but one vehicle is one vehicle. PDF |
Emissions were measured separately. On the Ethiopian diesel test, hydrocarbons fell from 317 to 66 ppm, about four fifths. Nitrogen oxides fell from 352 to 249 ppm. In Karnataka, Veritas measured diesel smoke on ten state-run buses: nine of the ten improved, by between 25 and 85 per cent.
One thing to know before you measure emissions. Fitting the device raises combustion temperature. On an engine that already carries carbon deposits, that burns the deposits off, and burning them produces carbon monoxide. So a CO reading taken soon after fitting can be higher than the baseline, and it settles once the deposits have gone.
The Ethiopian test is one reading before and one after, not a record over time, so it lands exactly in that window: hydrocarbons down sharply, NOx down, and CO up from 1.5 to 21.8 ppm. Both CO figures are very small in absolute terms.
If emissions are part of your decision, measure three times: before fitting, after a few thousand kilometres, and again at three months. The measuring method on our fleet quote page follows that schedule.
4. Who has been using it, and for how long
This is the question we would ask first ourselves. A product that does nothing runs out of customers, because the people who bought it do not buy again.
Factories are the hardest test. The LPG / CNG model mounts on the gas pipeline and runs on factory boilers and production lines. One of them is the Ashirvad Pipes production line, part of the Aliaxis group, where 10 to 15 per cent energy saving was measured.
A factory’s gas meter is already on the wall, and consumption is reconciled against output every month. Nobody in that building is buying an idea. If the bill does not go down, they do not buy it, and they do not leave it fitted.
People who sell trucks put it in their own business. Our partners in India include TVS. It has been Ashok Leyland’s dealer since that manufacturer was founded, runs more than sixty commercial-vehicle workshops across four states, and by its own account accounts for 17 to 20 per cent of Ashok Leyland’s medium and heavy commercial vehicle sales nationally. Ashok Leyland is the third-largest bus manufacturer in the world.
People who repair trucks for a living do not stock something because of a fuel-saving advert.
And it has been going on for years. The documents on this page run from 2020 to 2026 and come from four countries. The technology has been sold since the 2000s, first as Moletech and now as Greentech. Distributors in Vietnam, India, the UAE and Ethiopia buy stock with their own money and come back for the next order. Someone who could not sell the first container does not buy a second.
5. Measure it on your own vehicles first
If we could only give one answer, this is it.
Log a baseline from your own fuel and odometer records before you order, then keep logging after installation, over enough distance to mean something, with nothing else changed. Log it in the online Fleet Fuel Log or on our Excel worksheet, and the arithmetic is done for you.
Your own fuel records are the strongest proof there is. When the saving shows up in your own litres and your own money, the case for fitting the whole fleet makes itself.
What we do not claim
- No single savings figure for every vehicle. It depends on the engine, its condition, the load and how it is driven. Largest at steady cruise, smallest at idle.
- Not EPA approved. The EPA approves no product of this kind, so nobody is.
- No marine classification society approval. Not DNV, not Lloyd’s Register, not ClassNK.
- It does not clean sludge already in your tank. It works on the combustion side and reduces engine carbon deposits over time. What has already settled in the tank is a separate job.
- No invented payback figures. Your payback is worked out from your own fill-ups and your own fuel price, and the Fleet Fuel Log does the sums for you. Where we quote a customer’s payback, we say whose calculation it was.
- Older or hard-worked fleets should start with a small group. Better combustion can raise output slightly, and an engine already at the edge of its mechanical tolerance can show an existing weakness. For vessels, a Pre-Installation Survey is mandatory.
If you are still not convinced
That is reasonable, and no website should change it.
The only thing that should is a number measured on your own vehicles, against your own records, over enough distance that weather and traffic average out.
So: measure your own fuel first, online in the Fleet Fuel Log or with the worksheet we supply. Or read the full report library, where the laboratory, university, government and fleet documents are published whole. The case studies are there too.
If you want to know which model fits your tank, the product selector goes by fuel type and tank capacity.
Questions: partner@greentech.tw.
Sources
- US Federal Trade Commission, “FTC Offers Tips to Stretch Your Gas Dollars”, 2011.
- US Environmental Protection Agency, Evaluation Program for Aftermarket Retrofit Devices (511 Program).
- Australian Securities and Investments Commission action against Firepower’s founder, July 2011; Western Australian Department of Consumer Protection testing; Australian liquidation, July 2008.
- Every Greentech document named above is published in full in the report library.
Last reviewed September 2026. If you think there is a claim on this site we cannot support, write to us and we will either evidence it or remove it.
Seen the evidence? Now pick your model.
The fleets, the national test body and the factories on this page used these models. Choose by fuel and tank size, then order online.
Swipe to see more →
 G10A
Ethiopia’s national conformity body: a Suzuki Dzire used 18% less gasoline over the same distance.
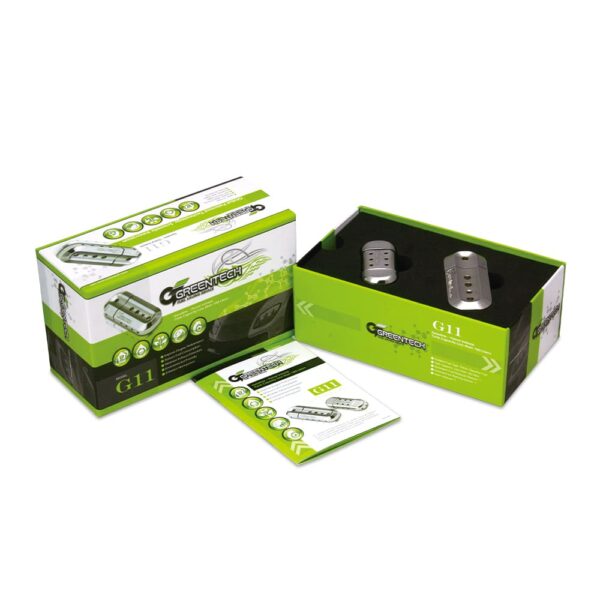 G11
Belhasa, Dubai: a Toyota Hilux went from 8.97 to 11.14 km per litre in the city.
 D10
Ethiopia’s national conformity body: a Toyota Hilux used 33.6% less diesel. Goodwill Autos, India: generators used 11.5% and 24% less per running hour.
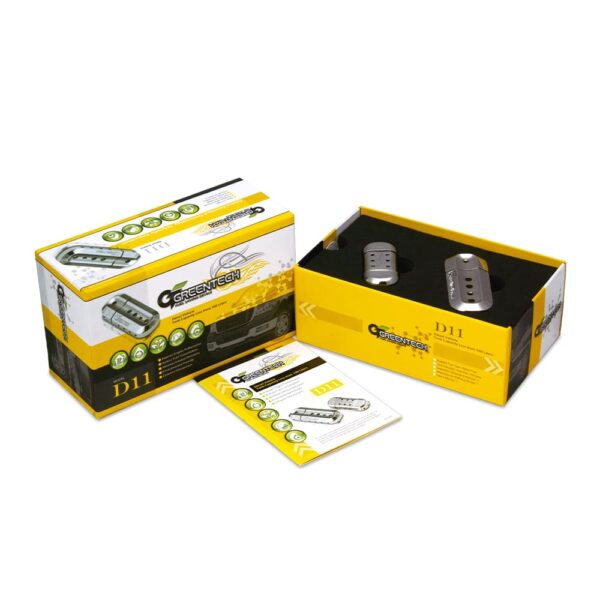 D11
Belhasa, Dubai: a JMC pickup went from 8.68 to 10.05 km per litre in the city.
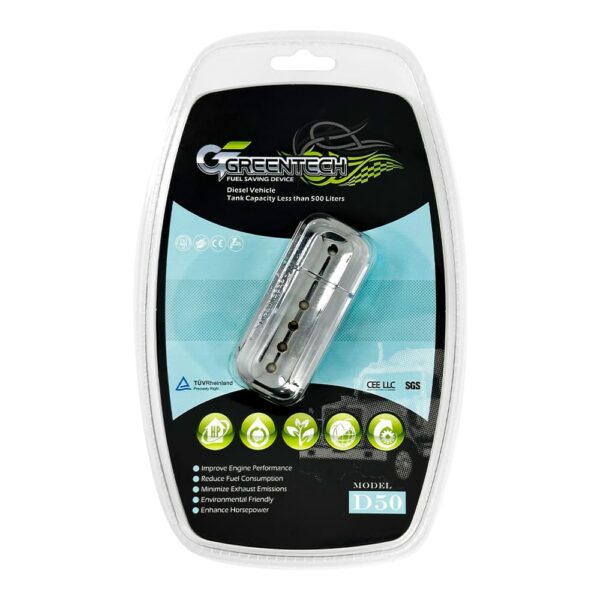 D50
Yalçın Nakliyat, Türkiye: 14.2% on an IVECO, 12.25% on a BMC Tuğra.
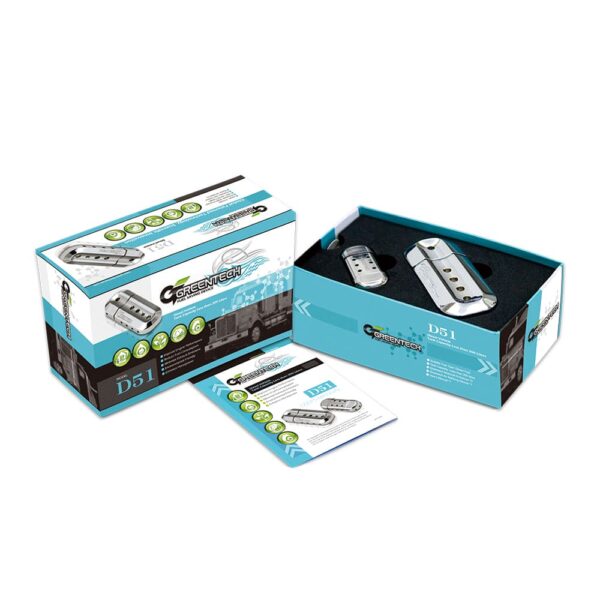 D51
Bin Sraiya, Qatar: 2.6 to 3.5 km per litre. Four trucks in India: 219,793 km, every one improved by 6.8–7.7%.
 LPG
Answer two questions, fuel and tank size, and the selector names the model. Fitting a whole fleet? Ask for a quote.
Results vary with engine condition, load, route and driving.