

ESG Documentation Pack
For sustainability teams and ESG / carbon consultants: the four things you need to put Greentech into a carbon inventory or sustainability report — the measure description, the measurement method, the CO₂ conversion and the report list.
Reduction measure description
For the “reduction initiatives” section of a sustainability report, GHG inventory report or customer questionnaire. Fill in your own figures in the blanks.
- Measure
- Fuel-efficiency improvement for vehicles and combustion equipment (Greentech fuel enhancers fitted)
- Type
- Energy efficiency; reduces Scope 1 emissions (mobile and stationary combustion)
- Product
- A patented, passive fuel enhancer — Proprietary Greentech Fuel Enhancing Technology helps the fuel atomize finer and burn more completely.
- Emission sources
- Company cars, trucks, buses, construction machinery, generators; LPG / CNG combustion equipment (the gas unit is fitted in the gas supply line)
- How it is fitted
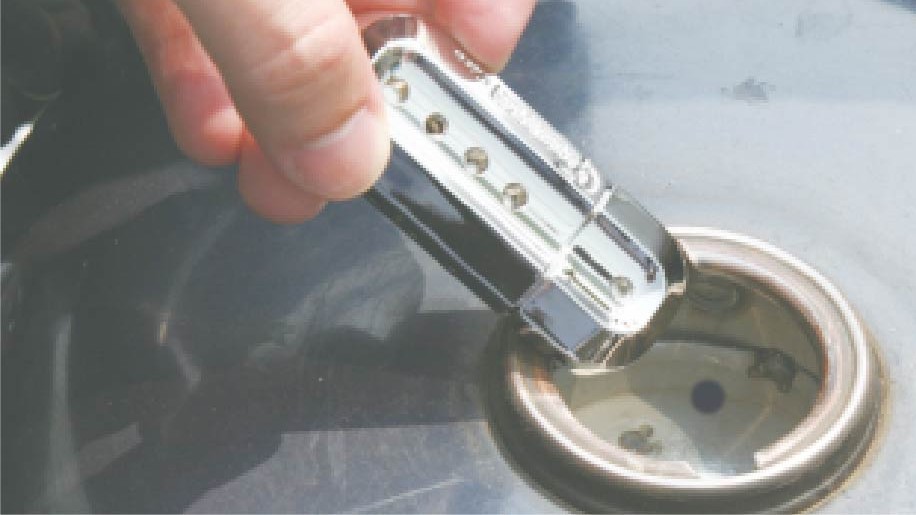
- Model chosen by tank size; it sits in the fuel tank, with no engine changes. Trucks and machines take it at refuelling; most cars are fitted at a workshop through the fuel-pump opening. Gas equipment needs an on-site check of pipe size and flow before fitting.
- Expected effect
- Documented fuel savings of 5–25%. Each vehicle is measured against its own original fuel use, so the percentage differs from vehicle to vehicle; results vary with engine condition, load and route.
- Quantification
- Fuel efficiency of the same vehicle before and after fitting (see 02); fuel saved × emission factor (see 03)
- Evidence
- Fuel receipts, invoices or fuel-card statements; odometer or hour-meter readings; vehicle list and product serial numbers; fitting dates; Fleet Fuel Log report
- Service life
- Physical technology, nothing consumed, 10+ years
Sample wording (paste into your report)
From ____ (month/year), the company fitted Greentech fuel enhancers to ____ diesel vehicles. Based on fuel records before and after fitting, fuel use for the same distance fell by ____%, saving about ____ litres of diesel a year — about ____ tonnes of CO₂ (diesel emission factor ____ kg CO₂ per litre, per our reporting scheme).
Measurement method
The same vehicle, compared with itself. This before-and-after comparison is what verifiers look for.
 1
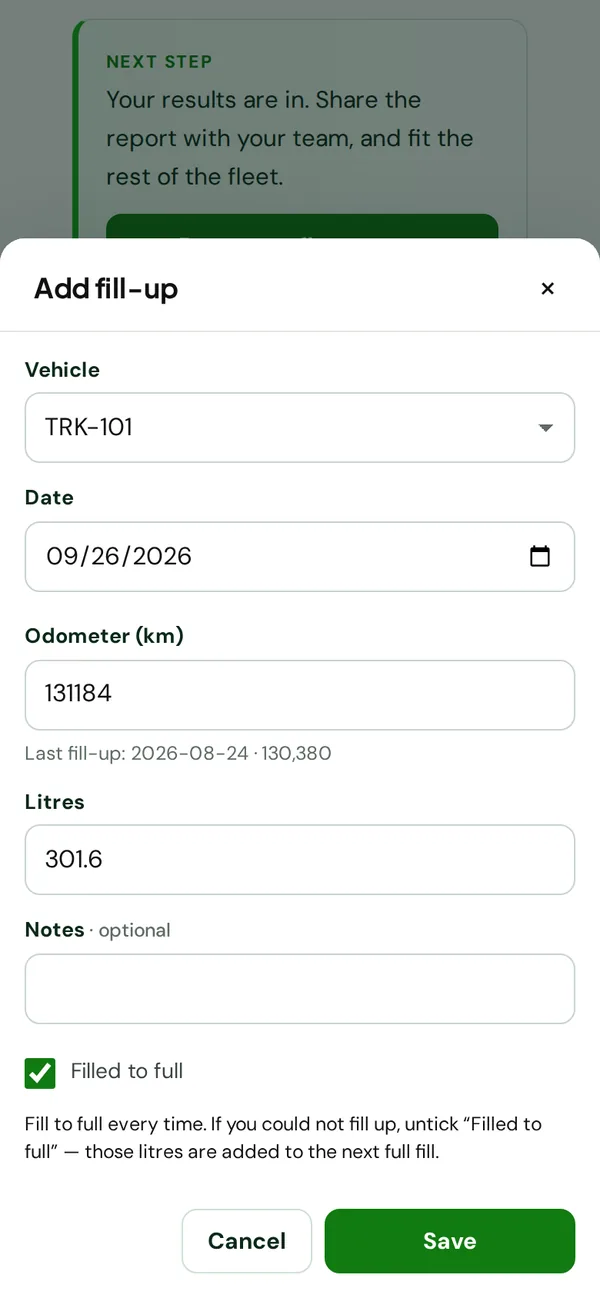
Record a baseline
At least three full-to-full fills per vehicle, covering more than 500 km or 20 engine hours; note the date, odometer or hours, and litres.
 2
Fit
Fit by tank size; note the fitting date and product serial number.
 3
Log after fitting
Record the same way, for at least as long as the baseline, on similar routes and loads.
 4
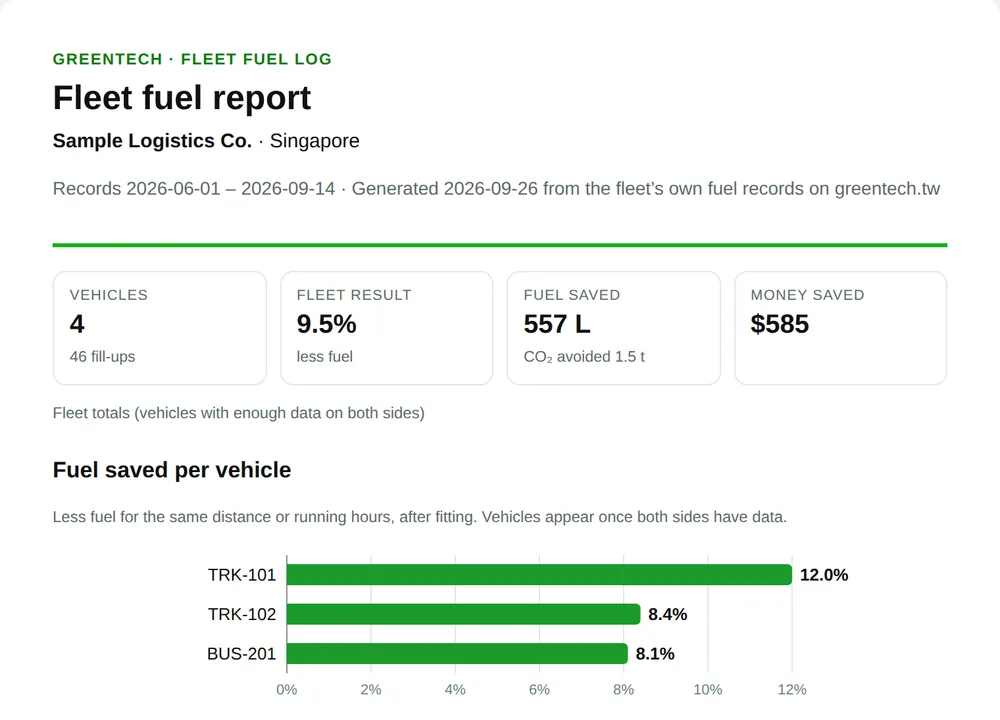
Calculate
Compare fuel efficiency before and after, then convert the fuel saved to CO₂ (see 03).
Which unit to compare
| Equipment | Fuel efficiency | Activity data from |
|---|---|---|
| Trucks, buses, company cars | litres per 100 km (or km per litre) | Odometer |
| Construction machinery, generators | litres per engine hour | Hour meter |
| Combustion equipment (kilns, boilers, dryers) | kg or m³ of gas per tonne of product | Gas meter and production records |
Formulas
e.g. in L/100 km: annual km ÷ 100 × (baseline − after)
Records to keep
- Fuel receipts, invoices or fuel-card statements
- Odometer or hour-meter readings (photos help)
- Vehicle list, product serial numbers, fitting dates
- Notes on major changes: routes, loads, repairs
Free tool
Fleet Fuel Log: enter your fuel records and it calculates the saving before and after fitting, the fuel and CO₂ saved, and produces a PDF report.
greentech.tw/fleet-log/
CO₂ conversion
CO₂ avoided (kg) = fuel saved × emission factor
| Fuel | Emission factor | Source |
|---|---|---|
| Diesel | about 2.68 kg CO₂ per litre | Typical value |
| Petrol | about 2.31 kg CO₂ per litre | Typical value |
| Taiwan | Diesel 2.606, petrol 2.263, LPG about 1.75 kg CO₂ per litre | Ministry of Environment factor table 6.0.4 |
| Natural gas | 56,100 kg CO₂ per TJ (convert with the heating value) | Ministry of Environment notice, 5 Feb 2024 |
| Your scheme | Use the factors your reporting scheme specifies | e.g. your national GHG registry |
- These are CO₂ factors; a formal inventory calculates CO₂e with the scheme’s own tool (including CH₄ and N₂O, usually a small addition).
- Factors are updated from time to time; use the values in force for your reporting year.
A worked example
- 10 trucks using 12,000 litres of diesel each a year: 120,000 litres
- 10% less fuel → 12,000 litres saved a year
- 12,000 × 2.68 = 32,160 kg → about 32.2 tonnes of CO₂
- Where you pay a carbon price, multiply the tonnes by that price (Taiwan’s carbon fee: NT$300 a tonne)
- Plus the fuel itself: 12,000 litres × your price per litre
Carbon prices apply only where a scheme covers you; the fuel money saved is usually far larger than the carbon cost.
Report list
Every document is a public original that opens directly; each figure is the operator’s own result against its own baseline.
Fleets: operators’ fuel records and letters
| Year | Organisation | What was measured | Document |
|---|---|---|---|
| 2025 | Hizam Transport (Saudi Arabia) | 10% less fuel, fleet average | Letter of appreciation ↗ (opens in a new tab) |
| 2020 | IFFCO transport fleet (UAE) | 7.4% less diesel on average across six heavy trucks (measured by Savex) | Fleet report ↗ (opens in a new tab) |
| 2020 | Anbessa City Bus (Ethiopia) | litres per km −8.89% | Fuel log ↗ (opens in a new tab) |
| 2020 | Sheger Mass Transport (Ethiopia) | litres per km −7.42% | Operator’s letter ↗ (opens in a new tab) |
| 2023 | Yalçın Nakliyat (Türkiye) | diesel on two trucks −12 to −14% | Signed test forms ↗ (opens in a new tab) |
| 2023 | ENK Plastik (Türkiye) | 38 → 31 L/100 km (−18.4%) | Signed test form ↗ (opens in a new tab) |
| 2023 | Bin Sraiya (Qatar) | diesel per km on the highway −25% | Signed & stamped letter ↗ (opens in a new tab) |
| 2023 | White Crown Transport (Qatar) | fuel −10% | Signed & stamped letter ↗ (opens in a new tab) |
| 2022 | Unimix (UAE) | fuel −10% | Signed company letter ↗ (opens in a new tab) |
| 2022 | Logistics Portserco (Vietnam) | city truck diesel −6.9% | Case study ↗ (opens in a new tab) |
| 2021–24 | TVS Mobility (India) | km per litre +10 to 15% | Signed & stamped letter ↗ (opens in a new tab) |
| 2020 | Grab driver-partners (Vietnam) | −9.5% average across 20 motorbikes | Trial records ↗ (opens in a new tab) |
Machinery and generators: per engine hour
| Year | Organisation | What was measured | Document |
|---|---|---|---|
| 2026 | Ramalingam Construction (India) | excavator −4.0% | Case study ↗ |
| 2022 | Shri Ponguru Blue Metal Mines (India) | excavator −22% | Stamped certificate ↗ (opens in a new tab) |
| 2021 | Vela Blue Metal (India) | wheel loader −15.8% | Signed certificate ↗ (opens in a new tab) |
| 2019 | Sri Balaji Borewells (India) | drilling-rig compressor −9.8% | Signed certificate ↗ (opens in a new tab) |
| 2022 | Goodwill Autos (India) | two 45 kVA generators −11% and −24% | Signed report ↗ (opens in a new tab) |
Industrial gas: combustion equipment
| Year | Organisation | What was measured | Document |
|---|---|---|---|
| 2024 | Indo Shell Cast (India) | about 20% less LPG per tonne | Seven plants’ published results ↗ |
| 2025 | Metsmith Innovations (India) | PNG −10 to −15% | Signed certificate ↗ (opens in a new tab) |
Emissions and air quality
| Year | Organisation | What was measured | Document |
|---|---|---|---|
| 2015 | KSRTC government buses (India) | smoke opacity −25 to −85% on nine of ten buses | Emission report ↗ (opens in a new tab) |
| 2025 | Can Tho vehicle inspection centre (Vietnam) | idle CO −93.6% on a motorbike; to zero on a car | Case study ↗ (opens in a new tab) |
| 2022 | Ethiopian Conformity Assessment Enterprise (ECAE) | fuel for the same distance: diesel −33.6%, petrol −17.95% | Test report ↗ (opens in a new tab) |
Third-party tests and patent
| Year | Organisation | What was measured | Document |
|---|---|---|---|
| 2023 | Bureau Veritas (Ethiopia) | distance per litre: diesel +36.2%, petrol +17.0%; +13.4% on a retest a year later | Test report ↗ (opens in a new tab) |
| 2023 | U.S. invention patent | US 11,713,737 B1 (one of several patents) | Patent certificate ↗ (opens in a new tab) |
Need help?
For model planning, quotes and fitting, or any other document, contact us directly. Where an authorised Greentech distributor covers the country, we connect you with them.
WhatsApp +886 920 280 503 · partner@greentech.tw · greentech.tw
This pack is public at greentech.tw/esg/pack/; the web page is always the latest version. Results vary with engine condition, load and route.